Clustering in Machine Learning: A Beginner's Guide
May 14, 2025
In this post, we’ll explore two popular methods, K-Means and Hierarchical Clustering, how they work, when to use each, and how to apply them to real-world scenarios
In linear and logistic regression, you had labeled data. You knew the "correct answer" for each data point (house price, or whether an email was spam).
What if you have a dataset where you don't have these predefined labels? What if you just have a collection of data points, and you want to see if there are any groupings within them? This is where we can use clustering.
Clustering is an unsupervised learning technique.
- Unsupervised: This means you don't provide the algorithm with pre-defined labels (Y). The algorithm's job is to explore the data and find these patterns on its own.
Analogy
You're given a big box full of mixed fruits: apples, bananas, and oranges. They don't have labels on them, but you can look at their characteristics (color, shape, size, texture). Your task is to sort them into piles.
You'd naturally put all the round, red/green items together (apples), the long, yellow, curved items together (bananas), and the round, orange, dimpled-skin items together (oranges).
You've just performed clustering! You identified groups based on similarities without anyone telling you beforehand "this is an apple" or "this is a banana."
So the key difference is that with classification (supervised) you know the categories beforehand (spam/not spam), and you train a model to assign new data to these pre-existing categories.
With Clustering (unsupervised): You don't know the categories. The algorithm discovers the categories from the data itself.
Another Real World Example
A company has data on its customers: their purchase history, browsing behavior, demographics, etc. They don't have pre-defined types of customers.
They could use clustering to:
- Identify distinct groups of customers (high-spending shoppers, low-spending shoppers, new customers).
- Once these clusters are identified, the company can make marketing strategies, product recommendations, or services specifically for each group.
K-Means Clustering
The goal of k-means clustering is to group data points, such that points in the same cluster are more similar to each other than to those in other clusters.
The K-Means Algorithm Steps:
- Choose K: Specify the number of clusters (K) you want to find
- Initialize Centroids (distance of data points to the cluster's center): Randomly select 'K' data points from your dataset to be the initial centroids
- Assign Points to Closest Centroid: For each data point in your dataset, calculate its distance (commonly Euclidean distance) to each of the 'K' centroids. Assign the data point to the cluster whose centroid is closest
- Update Centroids: For each cluster, recalculate its centroid by taking the mean of all the data points assigned to that cluster. This new mean becomes the new location of the centroid
- Repeat: Repeat steps 3 and 4 until the centroids no longer change significantly, or a maximum number of iterations is reached
Exercise
Imagine you have the following 1D data points: [1, 2, 3, 8, 9, 10] and you decide to find K=2 clusters. Let's say for Step 2, the initial centroids are randomly chosen as:
Centroid 1 (C1) = 2
Centroid 2 (C2) = 9
Assignment Step: Which points would be assigned to C1 and which to C2? Update Step: What would be the new locations for C1 and C2 after this first assignment?
The results after the assignment step:
- Cluster 1 members: {1, 2, 3}
- Cluster 2 members: {8, 9, 10}
We now recalculate the centroids based on the means of their current members:
- New C1: Mean of {1, 2, 3} = (1 + 2 + 3) / 3 = 2
- New C2: Mean of {8, 9, 10} = (8 + 9 + 10) / 3 = 9
This tells us that the algorithm has converged (the centroids are no longer moving and the process stops).
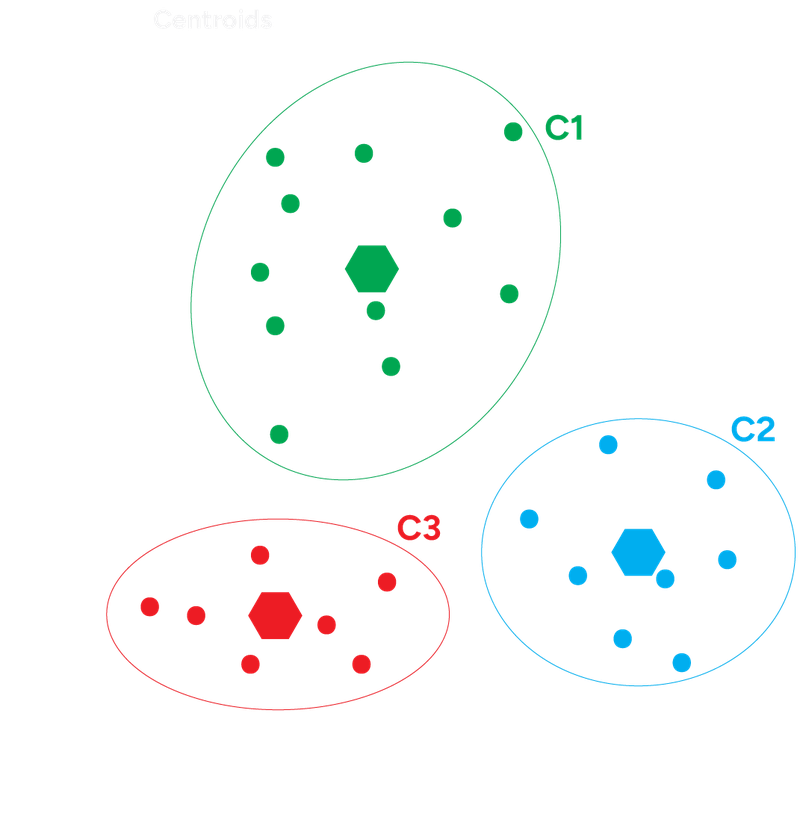
K-Means Clustering Example
Choosing K
One popular heuristic to choose the total of K clusters is the Elbow Method. The Elbow Method involves running the K-Means algorithm multiple times with a range of different 'K' values (K=1, K=2, K=3, ...). For each 'K', we calculate the inertia (also known as Within-Cluster Sum of Squares - WCSS). A lower inertia means the points are closer to their centroids.
What we look for, on a graph, is a point on the plot where adding another cluster doesn't give much better modeling of the data. This point looks like an "elbow" in the graph.
The idea is that after the elbow point, you're splitting already well-formed clusters, leading to smaller returns. The 'K' value at the elbow is a good candidate for the number of clusters.
The elbow method gives you a good guess, but it’s not always correct. Sometimes the elbow is not very clear, or there might appear to be multiple elbows. In such cases, you might also use want to try other methods.
But for many cases, the Elbow Method provides a good starting point.
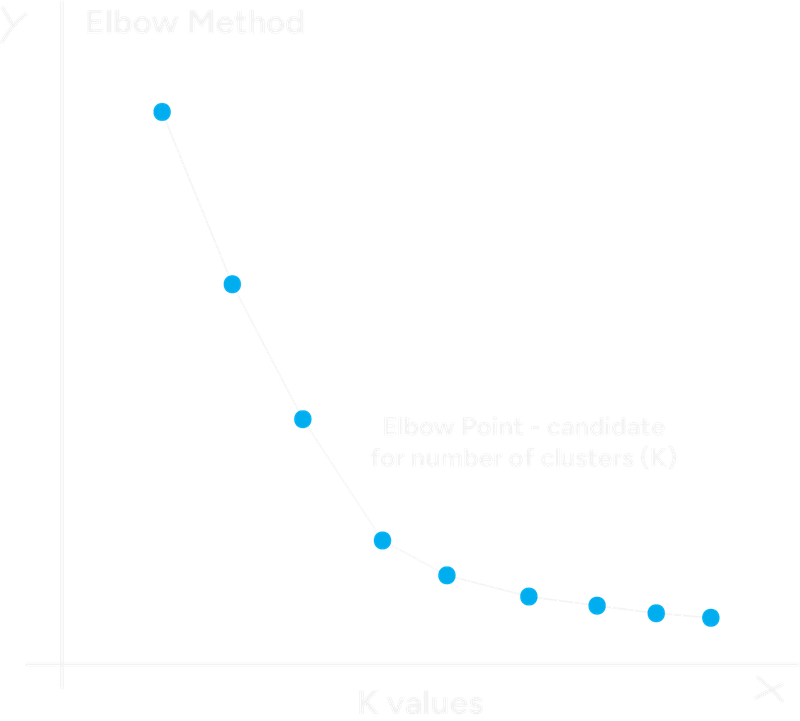
Elbow Method Example
Final notes:
- Choosing K: The number of clusters 'K' must be specified beforehand (you can use the Elbow Method).
- Initialization of Centroids: The initial placement of centroids can affect the final clustering results. Therefor it's common to run the K-Means algorithm multiple times with different random initializations.
- Feature Scaling: Just like with KNN (logistic regression), because K-Means relies on distance calculations, it's very important to scale your features before applying the algorithm.
Hierarchical Clustering
This approach is different from K-Means, because you don't need to specify the number of clusters (K) beforehand. Instead, it builds a hierarchy of clusters.
Hierarchical clustering creates a tree-like structure of nested clusters, called a dendrogram. There are two main types:
- Agglomerative (bottom-up) – most common
- Divisive (top-down) – less common
We will focus on Agglomerative, as it's more widely used.
The Hierarchical Clustering Steps:
- Start: Every data point is its own cluster.
- Find the two closest clusters (based on a distance metric).
- Merge them into a new cluster.
- Repeat steps 2–3 until: All points are merged into one cluster, or you reach a desired number of clusters by "cutting" the tree at a certain level.
Measuring distance between clusters
You can choose how to measure the distance between clusters. Common methods:
- Single linkage: closest points (minimum distance)
- Complete linkage: farthest points (maximum distance)
- Average linkage: average distance between all pairs
- Ward’s method: minimizes total variance within clusters (often gives compact clusters, this is a very popular and often effective choice)
Each method can result in different clustering shapes and results.
Once you have the dendrogram, you can obtain a specific number of clusters by cutting the dendrogram horizontally at a certain height.
Example
Let's use a very simple 1D dataset again: Points = [1, 2, 6, 7, 10]. The initial cluster would be {1}, {2}, {6}, {7}, {10}.
- First Merge: The smallest distance is 1 (between 1 & 2, and between 6 & 7). New clusters: {1,2}, {6}, {7}, {10}
- Second Merge: Next smallest distance is 1 (between 6 & 7). New clusters: {1,2}, {6,7}, {10}
- Third Merge: Next smallest distance is 3 (between (6,7) and 10). New clusters: {1,2}, {6,7,10}
- Final Merge: Merge (1,2) and (6,7,10) at distance 4.
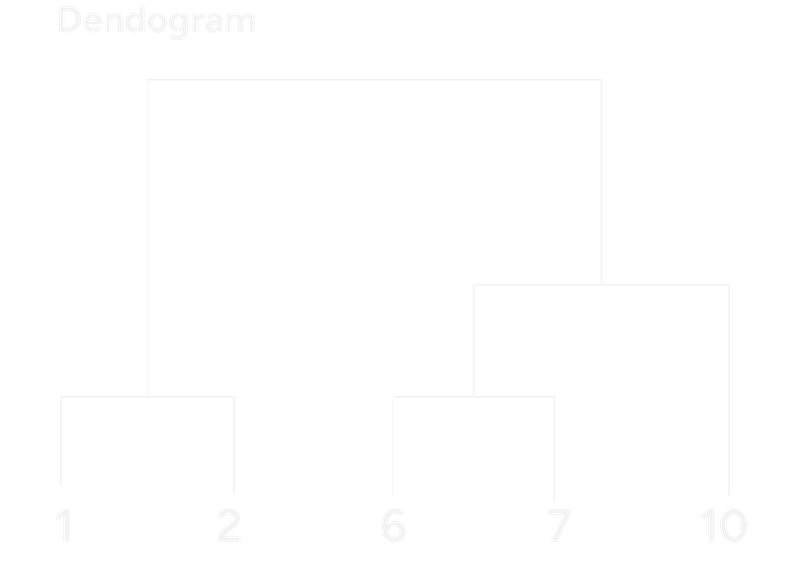
Dendogram Example
Final Challange!
You are given a dataset of online shoppers with features:
Online Shoppers
| age | annual_income | items_purchased_last_month | spending_score |
|---|---|---|---|
| ... | ... | ... | ... |
You want to segment these shoppers into distinct groups to tailor marketing campaigns.
- Which clustering algorithm (K-Means or Hierarchical) might you start with, and why?
- What data preprocessing steps would be absolutely essential before applying either algorithm?
- If you chose K-Means, how would you approach selecting 'K'?
- Once you have your clusters, what would you do to understand who these different groups of shoppers are?
Answers
- I would start with: K-Means. The dataset is numeric and all features are numerical, which is great for K-Means. K-Means is the go-to for speed and simplicity.
- Use StandardScaler or MinMaxScaler to bring everything onto the same scale. Check for outliers. If data is missing, either impute or remove those rows.
- Elbow Method
- Profile Clusters (average values per feature per cluster), Visualize (for example boxplots to see distributions), Give Personas (for example "Bargain Hunters")
Fin.